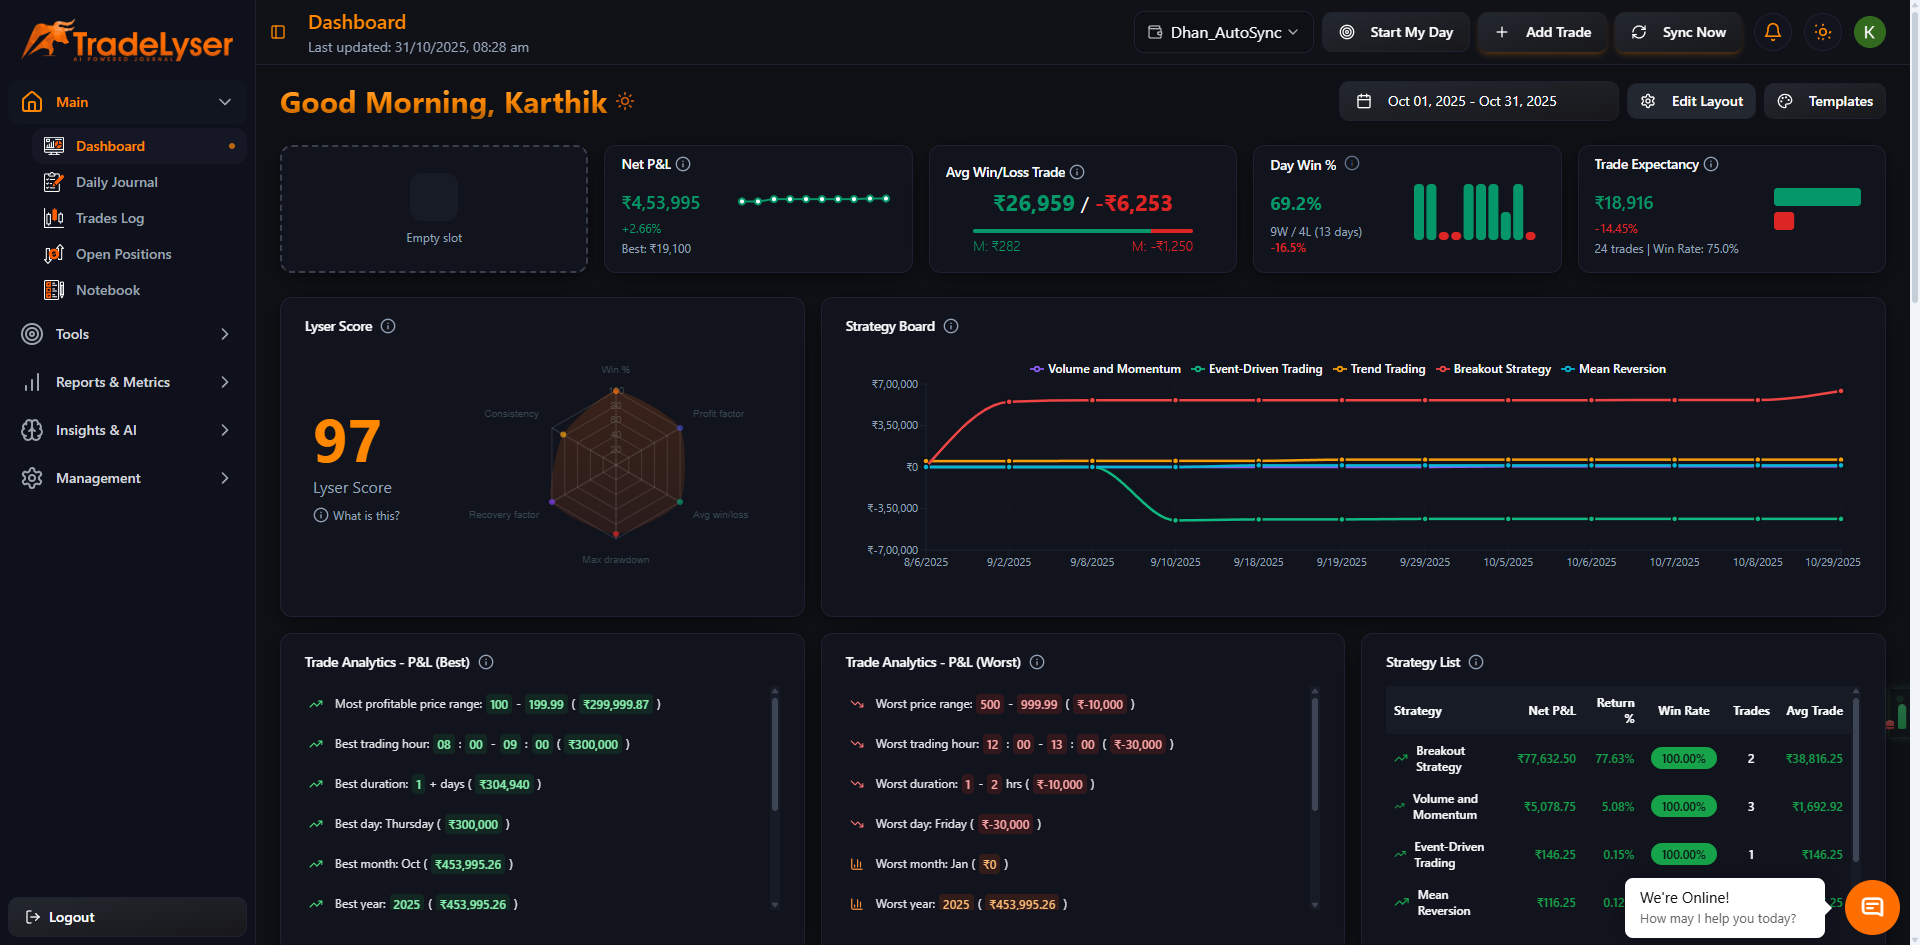
How to Use P&L Widget
Overview
Quick-glance P&L display on your dashboard.
What It Shows
💰 Total P&L for selected period
💰 Color-coded (green/red)
💰 Percentage change
💰 Trend indicator

Adding to Dashboard
- Edit dashboard layout
- Click "+ Add Widget"
- Select "P&L Widget"
- Choose small or large version
- Save
Interpretation
🟢 Green: Profitable
🔴 Red: Losing
⚪ White: Breakeven
Responds to Filters
- Account selection
- Date range
- Active filters
Quick Tips
- Add to top of dashboard
- Check first thing daily
- Combine with win rate
- Track trends
Next Steps
Troubleshooting
Shows zero? No trades in range
Wrong amount? Check filters
Need help? Contact support@tradelyser.com