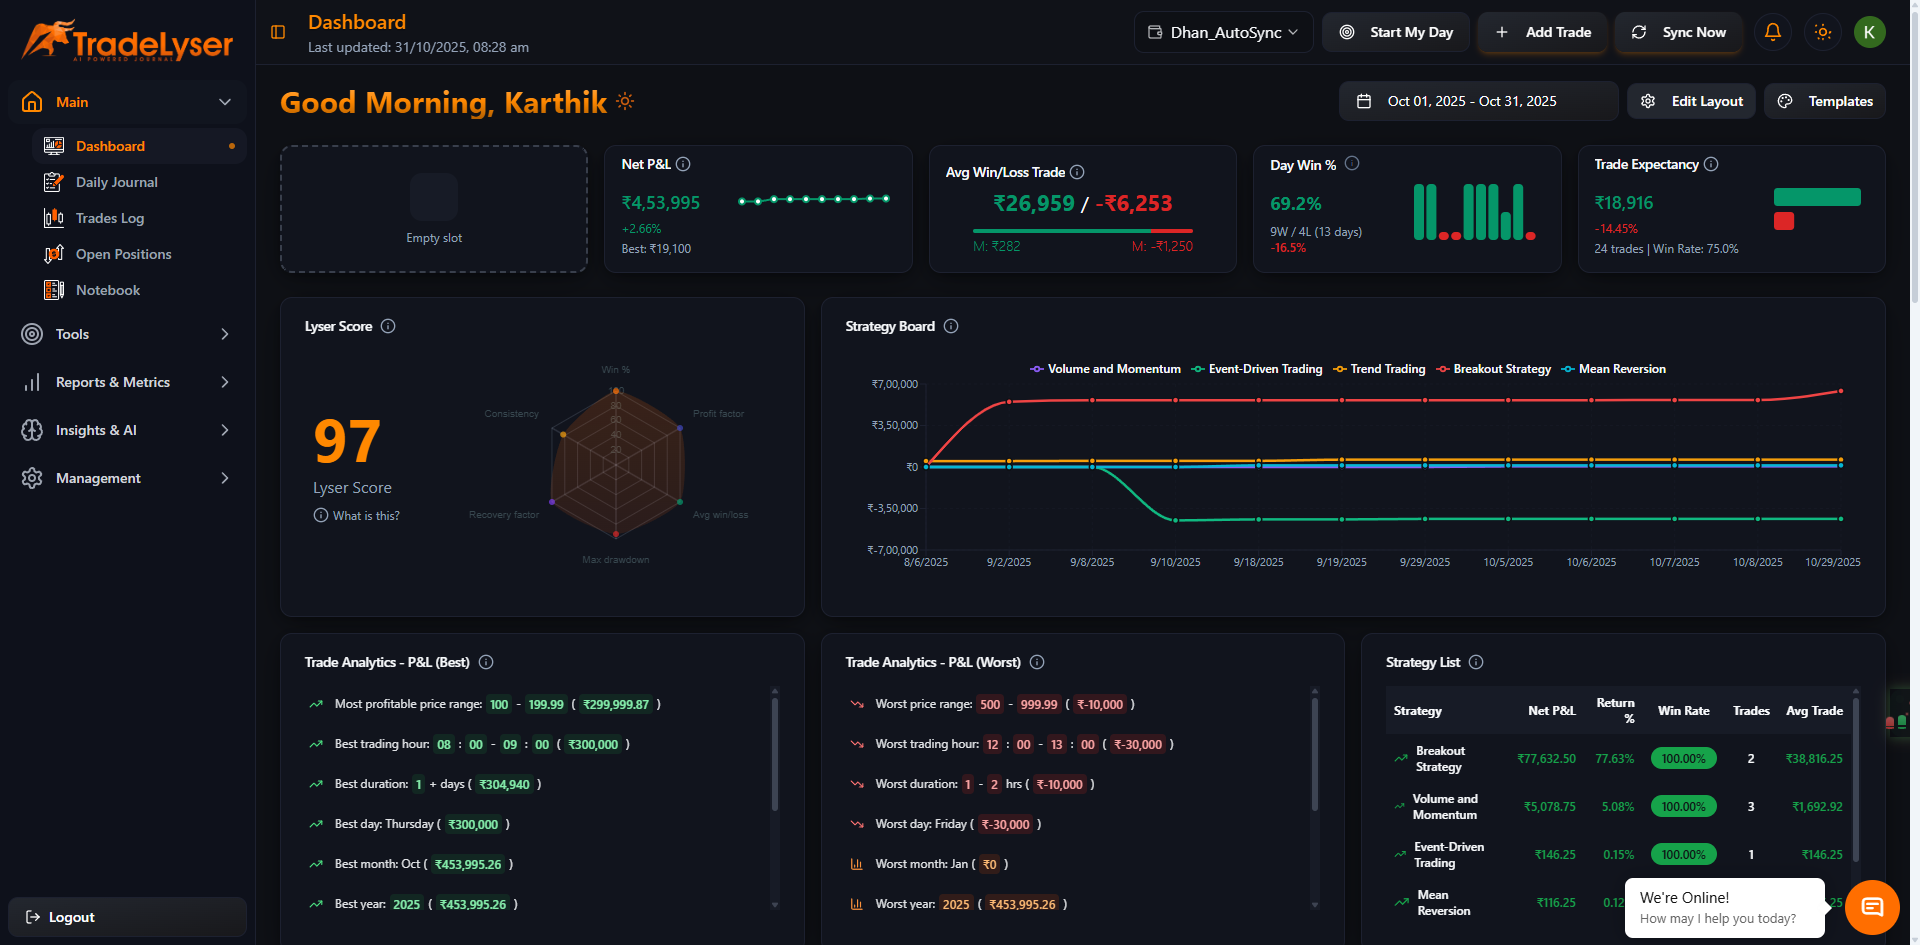
How to View and Analyze Equity Curve
Overview
Visualize your cumulative P&L growth over time.
Steps
1. Go to Reports
Navigate to Reports > Performance

2. View Equity Curve
Chart shows:
- Cumulative P&L over time
- Running total of profits
- Growth trajectory
- Peak and trough points

3. Analyze Trends
Look for:
- Upward slope (profitable)
- Flat periods (consolidation)
- Drawdown valleys (losses)
- Recovery patterns

Success!
Understanding your equity curve!
What Equity Curve Shows
📈 Growth: Upward trending
📊 Consistency: Smooth vs jagged
📉 Drawdowns: Decline periods
🎯 Recovery: Bounce back speed
Ideal Equity Curve
✅ Upward sloping
✅ Relatively smooth
✅ Small drawdowns
✅ Quick recoveries
Warning Signs
⚠️ Flat or declining
⚠️ Large drawdowns
⚠️ Slow recovery
⚠️ High volatility
Quick Tips
- Check weekly
- Compare to goals
- Note drawdown periods
- Track improvement
Next Steps
Troubleshooting
Flat curve? Need more profitable trades
Too volatile? Improve consistency
Need help? Contact support@tradelyser.com