Trade Insights: Expectancy, Risk, Concentration and Alignment
These four Trade Insights tabs measure the quality of your trading rather than its size: how much you make per trade (Expectancy), how bumpy the ride is (Risk & Streaks), how dependent you are on a few instruments or days (Concentration) and how consistent your session and direction mix is (Alignment). Use them once P&L Analysis has shown you where the money goes.
Availability: Pro plan. Open it at app.tradelyser.com/trades-analysis/expectancy.
Like every Trade Analysis tab, these use the date range at the top right (last 12 months by default) and the account in the header, analyse closed trades only, and calculate insights with TradeLyser's rules engine at no credit cost. See How Trade Insights works for the shared terms (win, loss, underlying, sessions and duration buckets).
Expectancy
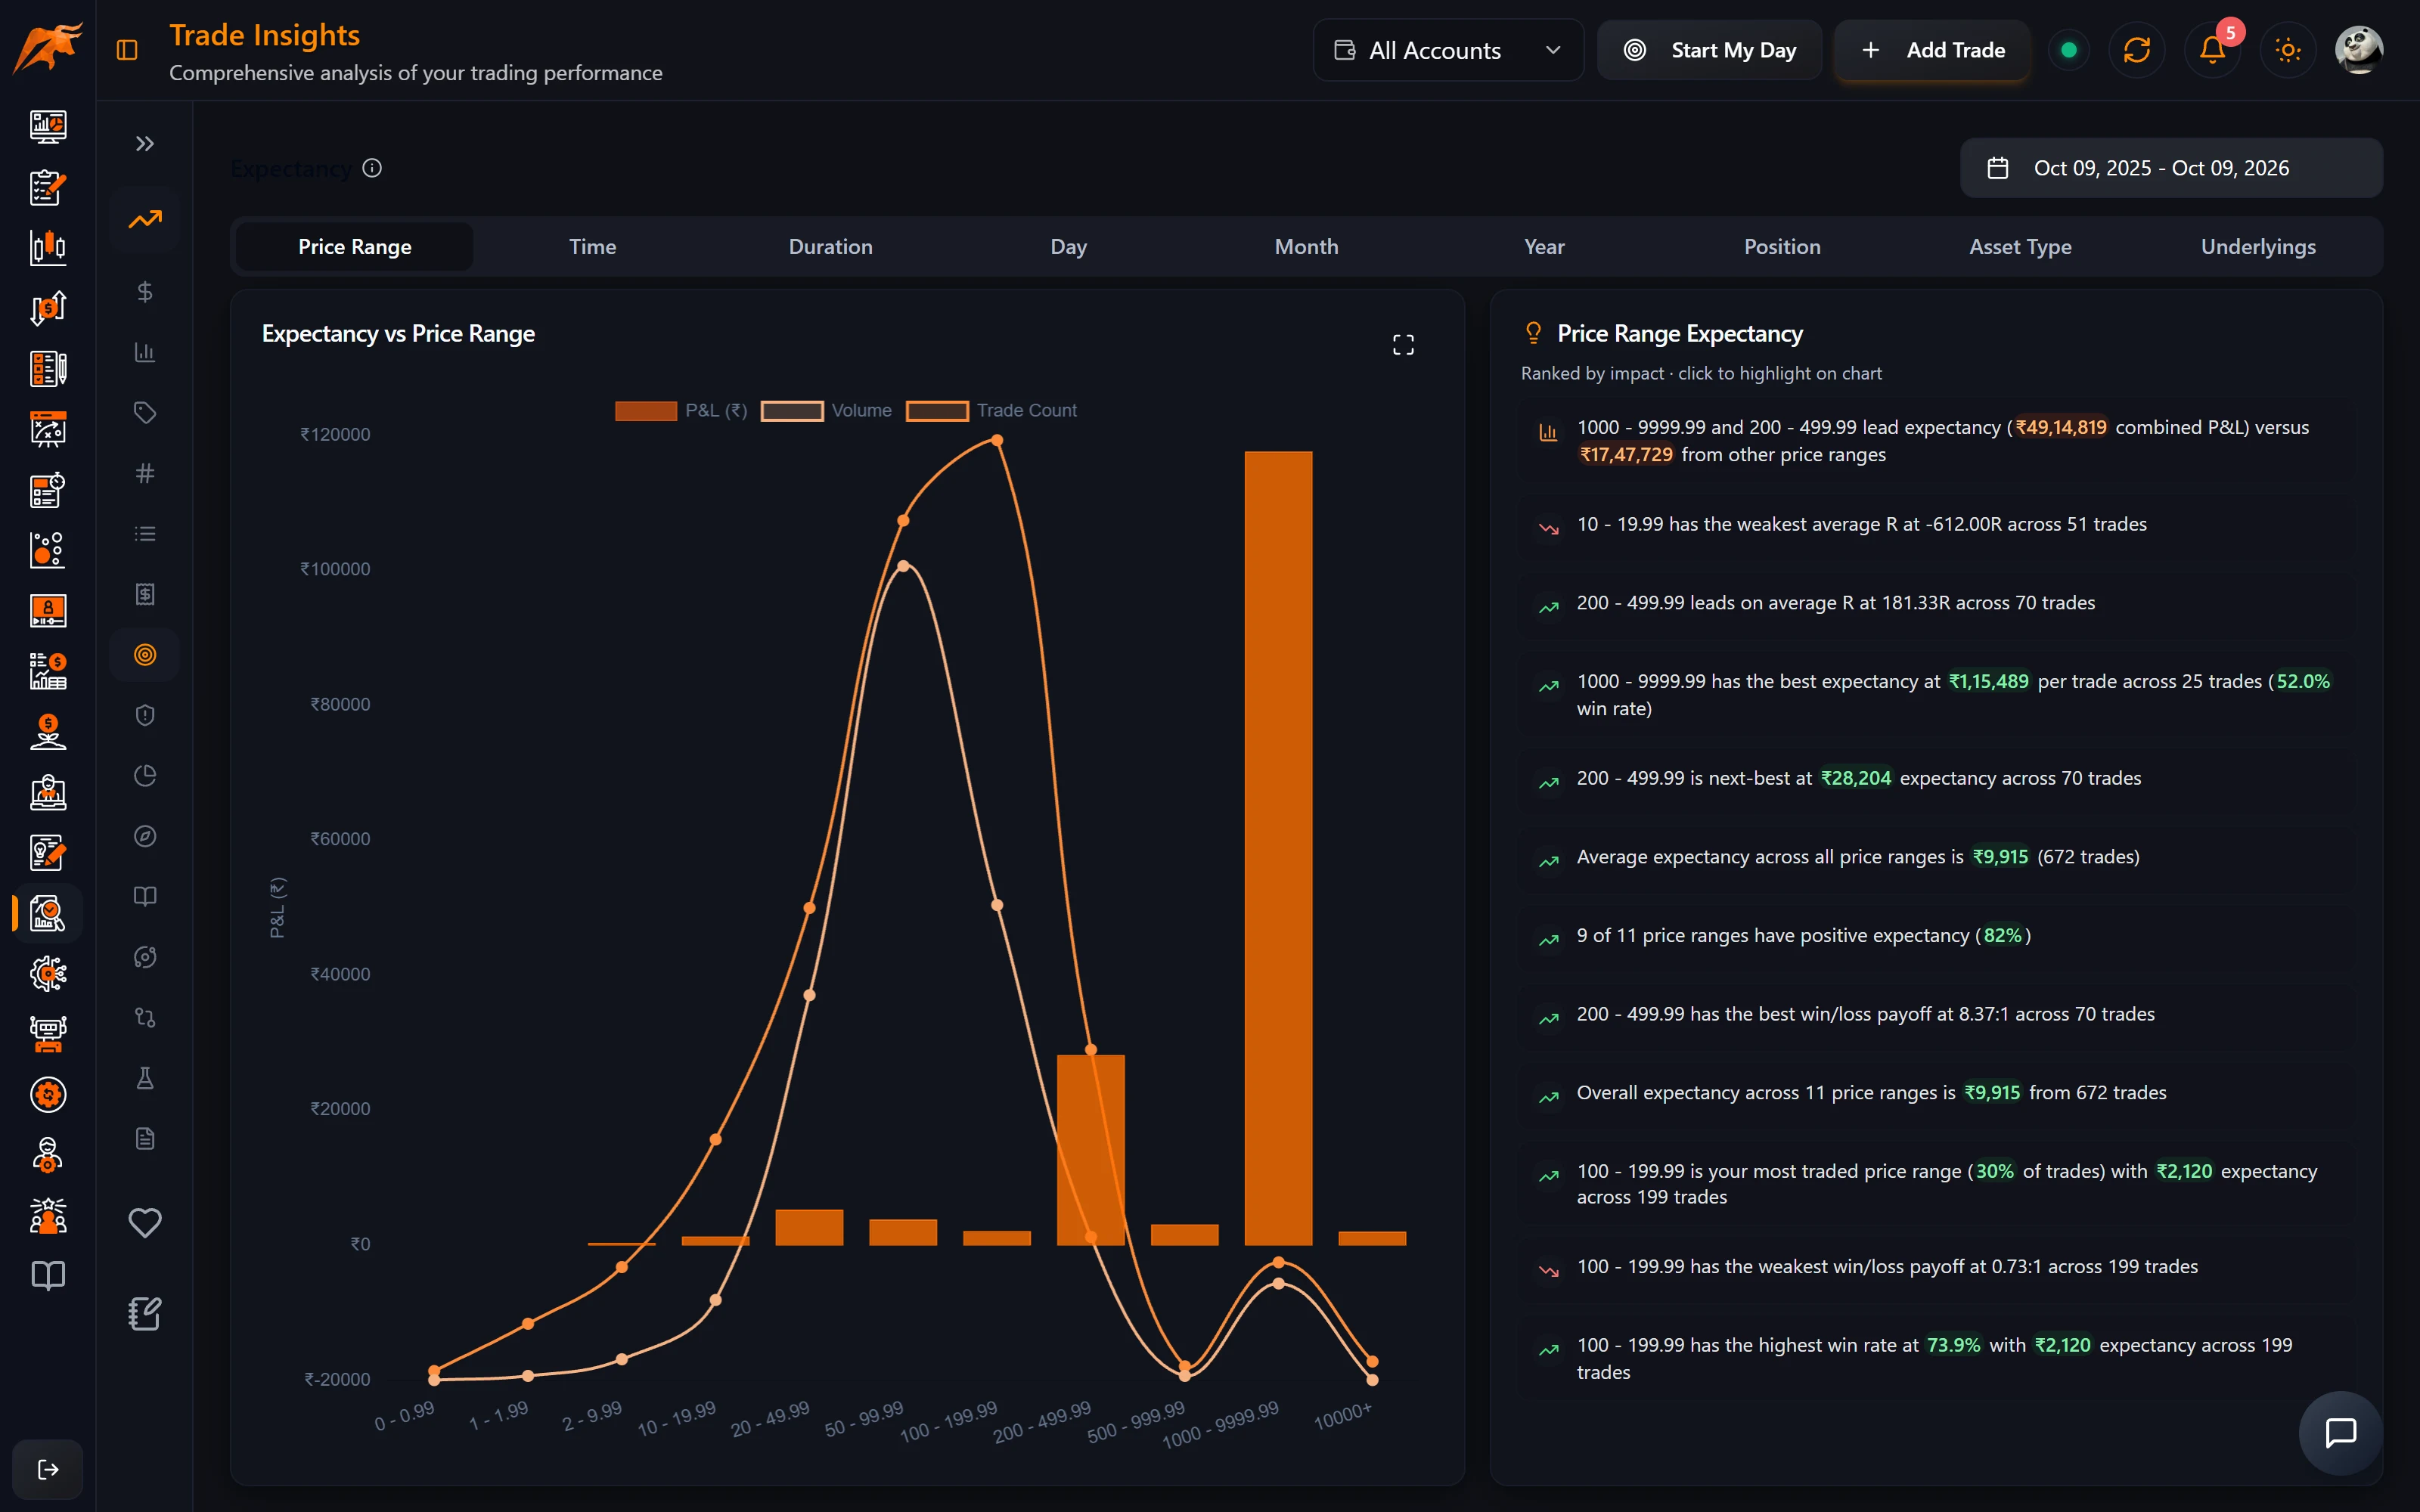
Expectancy is the average P&L per trade: (win rate × average win) − (loss rate × average loss). A positive number is an edge, the amount you can expect on average each time you take that kind of trade. For a fuller explanation, see Strategy statistics and metrics.
The chart shows expectancy by price range, time, duration, day, month, year, position, asset type and underlying.
| Insight | What it tells you |
|---|---|
| Best and worst buckets | Where each trade earns or costs you the most on average |
| Breadth | How many buckets have a positive expectancy |
| Payoff ratio | Average win ÷ average loss |
| Top two drivers | The two buckets contributing most to your result |
| Average R | Average R-multiple. Needs a stop loss on your trades so R can be calculated. |
Click any insight to see the trades behind it, each linking to Trade Details.
Friday shows an expectancy of −₹640 per trade over 30 trades. That's about −₹19,000 a year from Fridays alone. Stop trading Fridays or trade half size.
Risk & Streaks
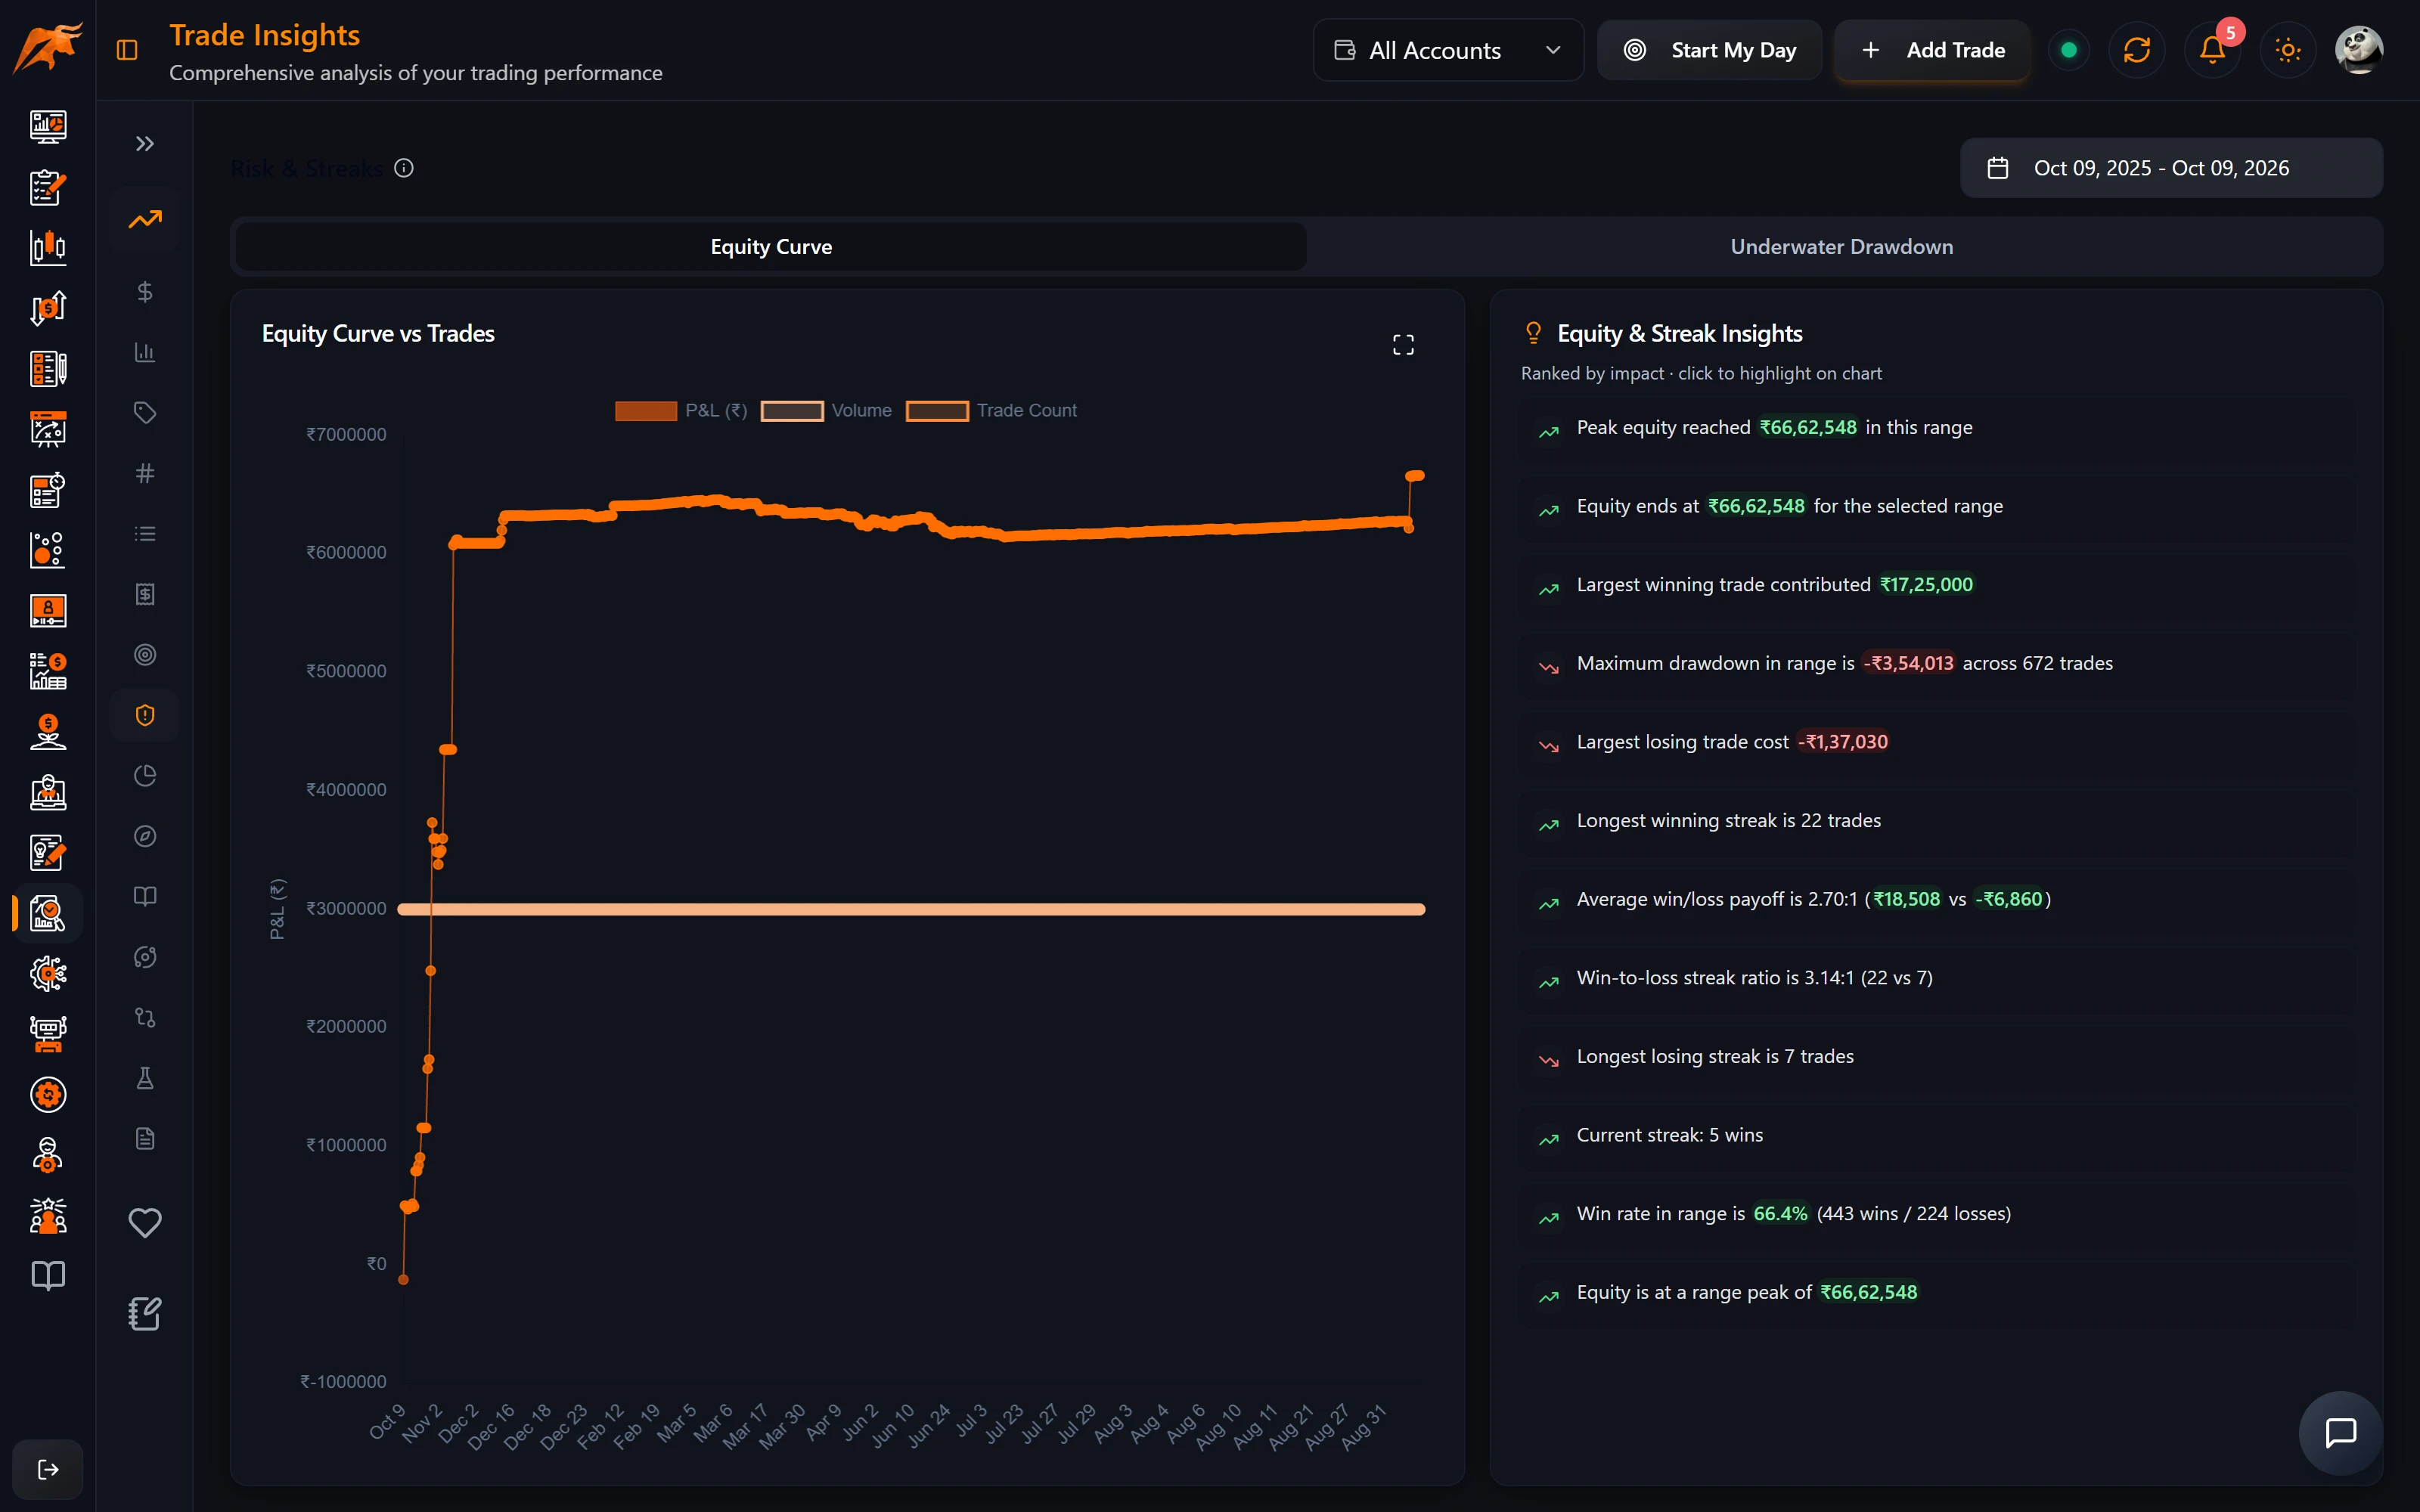
Risk & Streaks has two charts: the Equity Curve (cumulative net P&L, trade by trade) and the Underwater drawdown chart (how far below the previous peak you were). The www guide Equity curve and drawdown review covers what a healthy curve looks like.
| Measure | Meaning in TradeLyser |
|---|---|
| Max drawdown | The largest fall from a peak in cumulative P&L. Drawdowns are tracked once you have been in profit. Flagged when it is 20% or more of the peak. (Glossary) |
| Win / loss streaks | The longest runs of consecutive wins and losses. Breakeven trades don't break a streak. A losing streak of 5 or more is highlighted. |
| Recovery | How many trades it took to reach a new high after a drawdown, fastest and average. |
| Underwater share | The share of trades taken while below a previous peak. Flagged at 40% or more. |
| Payoff | Average win ÷ average loss. |
If your longest losing streak is 7 and recovery takes 12 trades on average, add a rule such as stop for the day after 3 consecutive losses to your Playbook or Discipline Diary.
Concentration
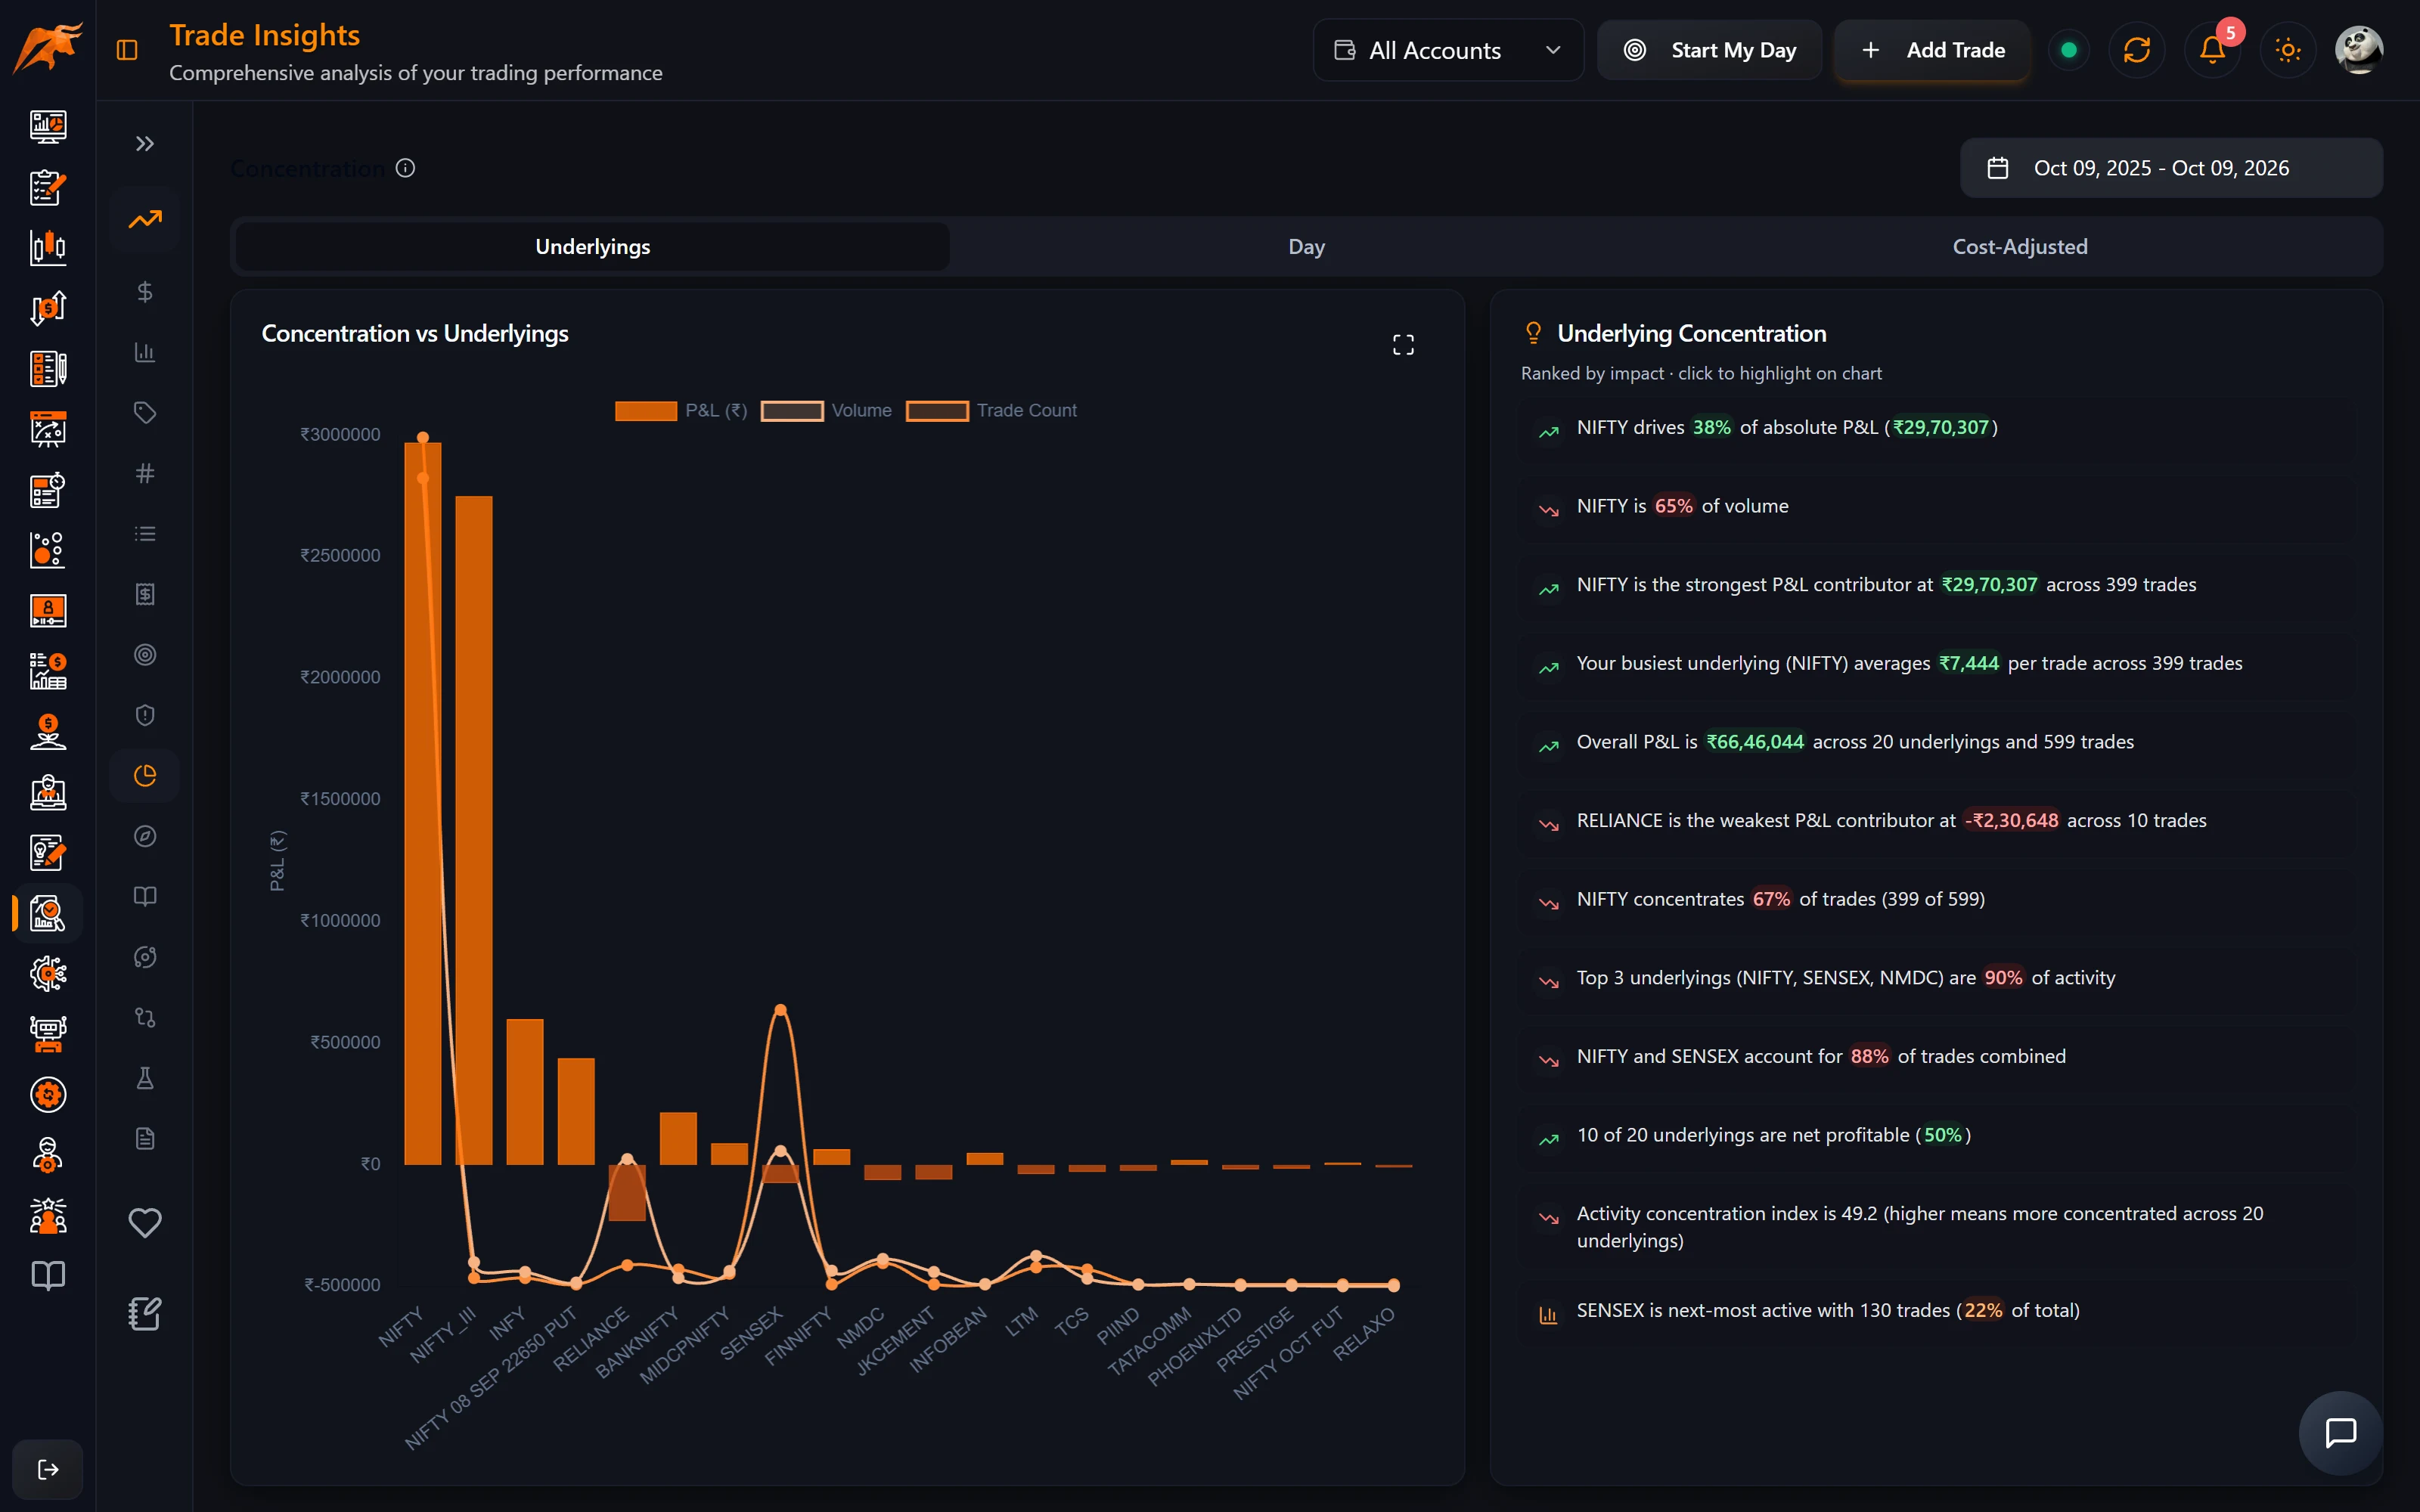
Concentration shows how dependent your results are on a handful of buckets.
| View | What it shows | Flagged at |
|---|---|---|
| Underlyings and Day | Share of activity and P&L from your top one, two and three buckets | 40%, 50% and 70% |
| Concentration index | A 0–100 score that is high when a few buckets dominate your trades | 25 or more |
| Cost-Adjusted | Each underlying's P&L after fees, taxes and slippage, and the cost drag (costs as a share of gross P&L) | Cost drag of 20% or more |
Clicking an insight on this tab opens the matching trades. The Cost-Adjusted view needs fees and taxes on your trades; set them under Accounts → Set Fees & Tax (Configure fees and tax).
If one underlying drives 70% of your P&L, you are effectively a single-instrument trader. Size your risk as if every trade were the same position.
Alignment
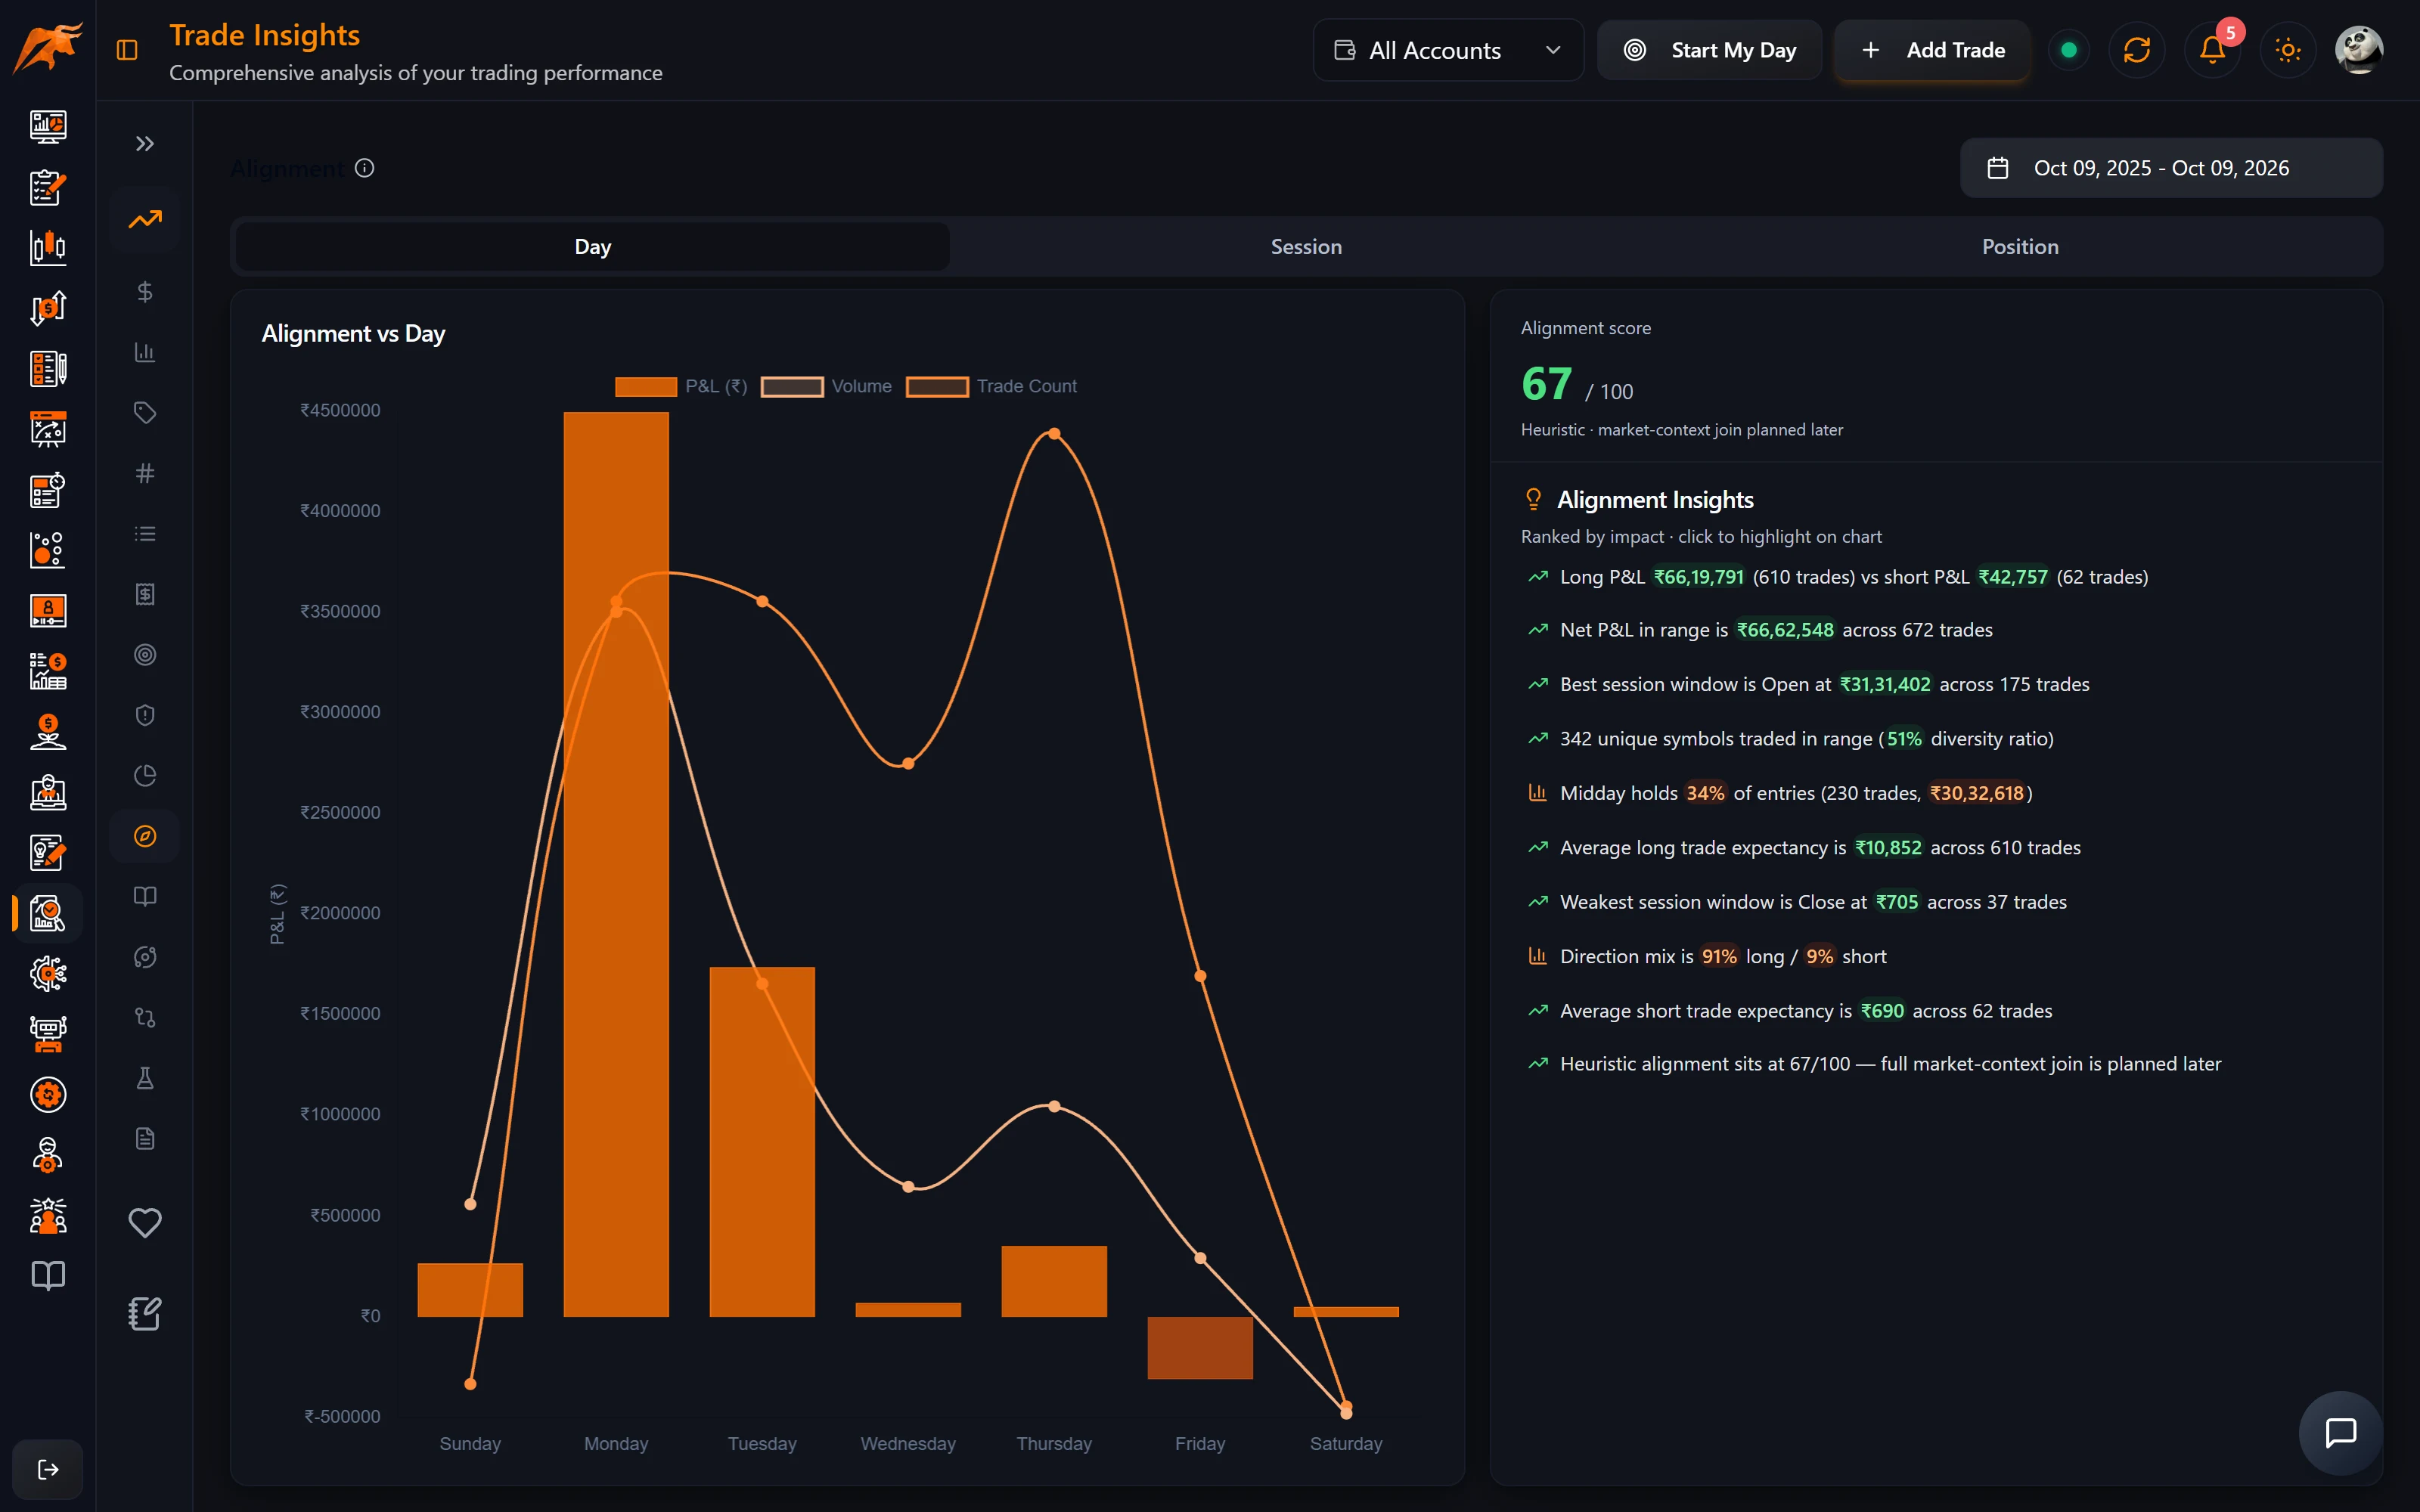
The Alignment score (0–100) is a guide to how well balanced your trading is across sessions, directions and symbols. It starts at 50 and moves up or down:
| Raises the score | Lowers the score |
|---|---|
| A profitable range | Losing in both directions (long and short) |
| A diverse set of symbols | Crowding most entries into one session |
| A profitable best session | Trading only one or two symbols |
| A losing session with five or more trades |
Green is 65 or above, red is 40 or below.
A score of 38 with the insight "Midday session lost ₹X" is a clear prompt to stop entering trades between 11:00 and 14:00. Turn it into a Playbook rule (Dimension: session) and test it first in What If.
Why are some numbers missing?
| Symptom | Cause and fix |
|---|---|
| No Average R insight | Your trades have no stop loss. Add stop losses so the R-multiple can be calculated. |
| Max drawdown looks too small | Drawdowns are only tracked once you have been in profit in the selected range. Widen the date range. |
| Cost-Adjusted P&L equals gross P&L | No fees or taxes are recorded for the account. Set them under Accounts → Set Fees & Tax. |
| A bucket has no pattern insight | Pattern insights need at least 5 trades in the bucket. |
| Everything is empty | Check the date range and the account selector. Only closed trades are analysed. |
Frequently asked questions
How do I calculate my trading expectancy in TradeLyser?
You don't need to. Open Trade Insights → Expectancy and TradeLyser shows your average P&L per trade for every bucket, along with your payoff ratio and breadth.
Where can I see my max drawdown and longest losing streak?
On the Risk & Streaks tab. The Underwater chart shows every drawdown, and the measures table lists max drawdown, win and loss streaks, recovery and underwater share.
What is a good Alignment score?
65 or above shows green. 40 or below shows red, which usually means you are losing in a session or trading too narrow a set of symbols.
Why does TradeLyser say my trading is concentrated?
Your top one, two or three underlyings or days account for 40%, 50% or 70% of your activity or P&L, or your concentration index is 25 or more.